Processing CloudFront logs with Sumo Logic
Getting site metrics
In previous posts I’ve talked about how to get usage statistics for static sites using Google Analytics and New Relic. Both of these solutions leverage javascript so that you don’t need a server to process usage. With the number of bots, ad blockers and other javascript stopping tools out there, you may notice your numbers don’t seem to add up. If you want a more accurate analysis of your traffic, you’ll need to process your logs. I have been using Sumo Logic for a while, so here’s a quick dive into how to set it up and what the dashboards look like.
Setting up CloudFront logging
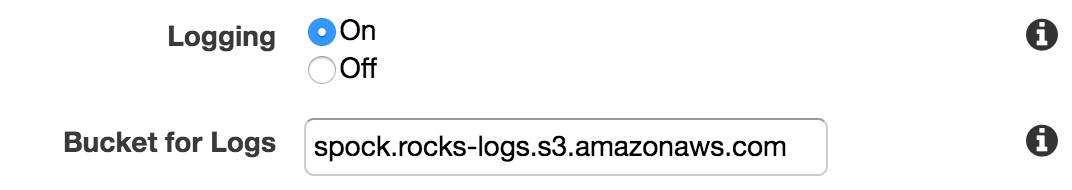
It’s literally two options in the CloudFront distribution:
- Turn it on
- Tell it where to put the logs
Screenshot as proof:
IAM policy
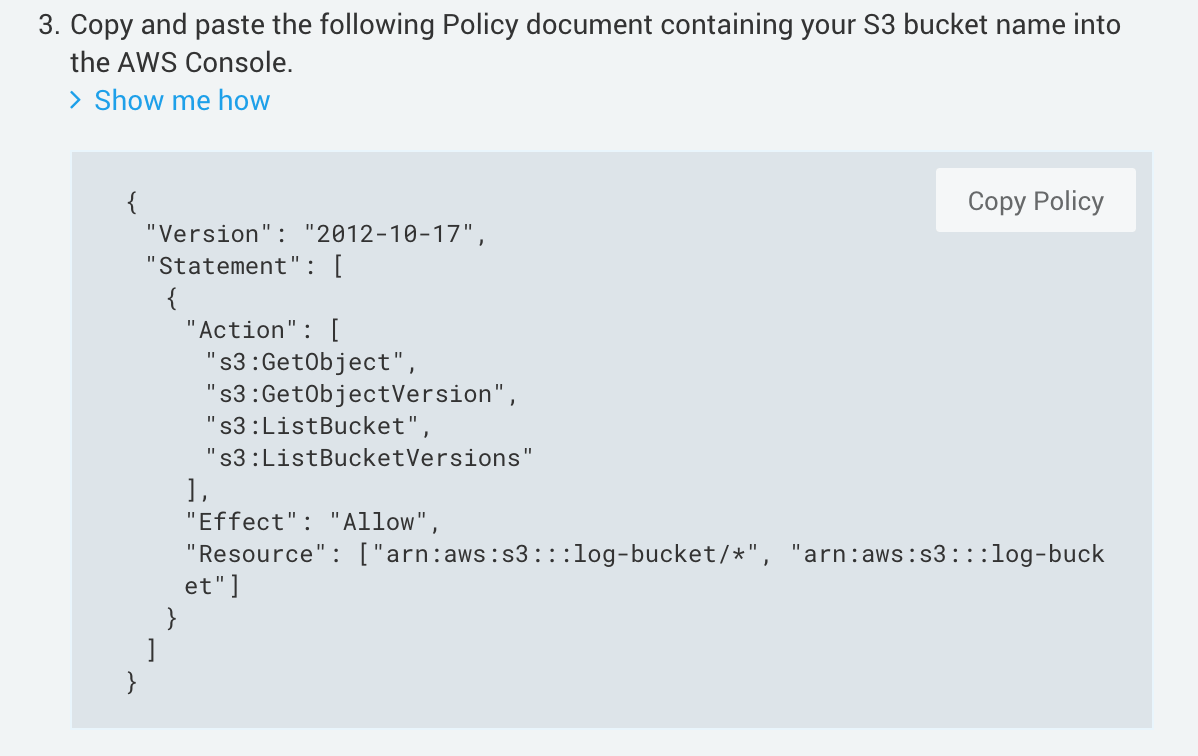
There is a document from Sumo Logic on how to setup the IAM policy here. Here’s the IAM policy I’m using for this blog. It matches what you’ll see in the article, it’s just formatted to be more readable:
{
    "Version": "2012-10-17",
    "Statement": [
        {
            "Action": [
                "s3:GetObject",
                "s3:GetObjectVersion",
                "s3:ListBucket",
                "s3:ListBucketVersions"
            ],
            "Effect": "Allow",
            "Resource": [
                "arn:aws:s3:::spock.rocks-logs/*",
                "arn:aws:s3:::spock.rocks-logs"
            ]
        }
    ]
}
Setting up Sumo Logic
Use the setup wizard to setup your dashboard. Here are the screenshots as of the writing of this post that show you what to expect. It’s easy.
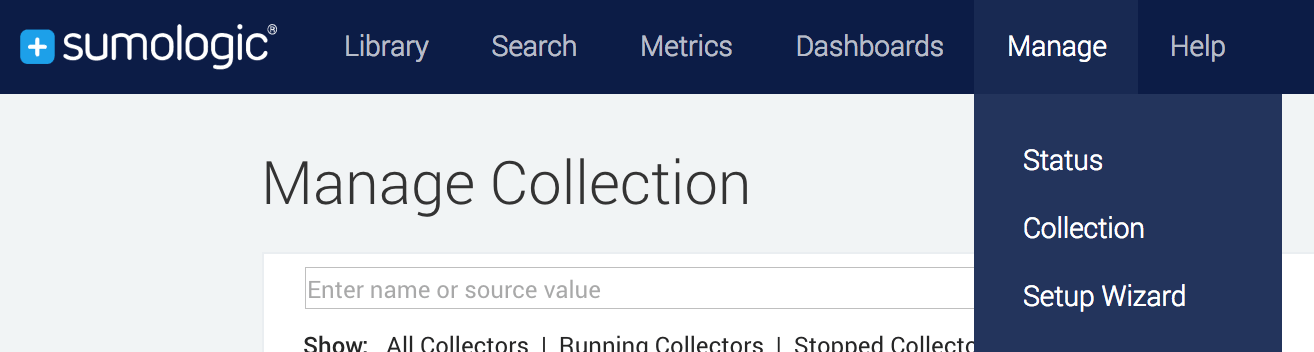
Step 1: Go to the “Setup Wizard” under the manage menu:
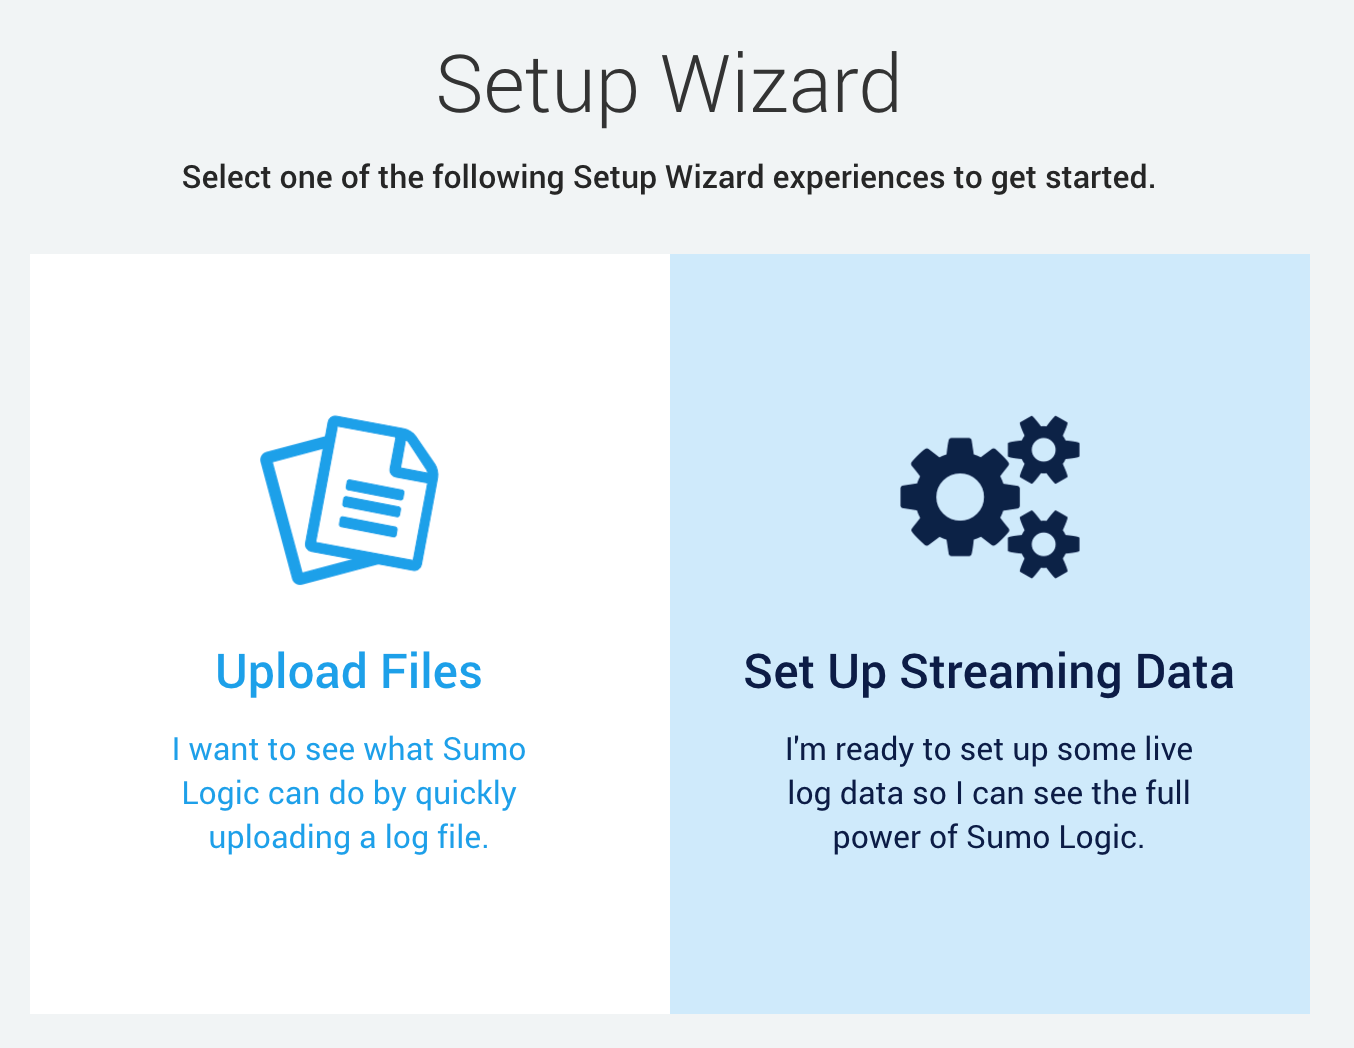
Step 2: Select “Set Up Streaming Data”:
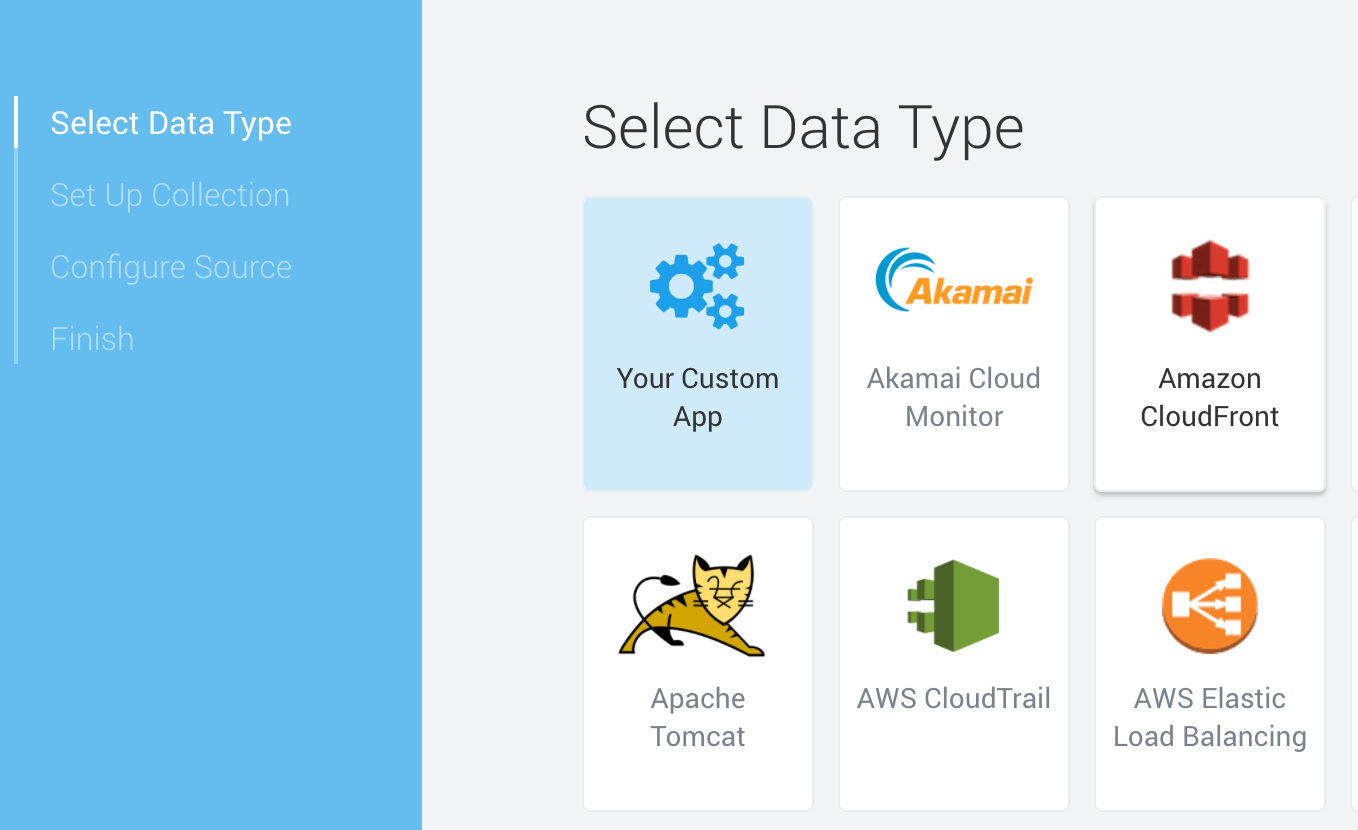
Step 3: Select “Amazon CloudFront” as the data type:
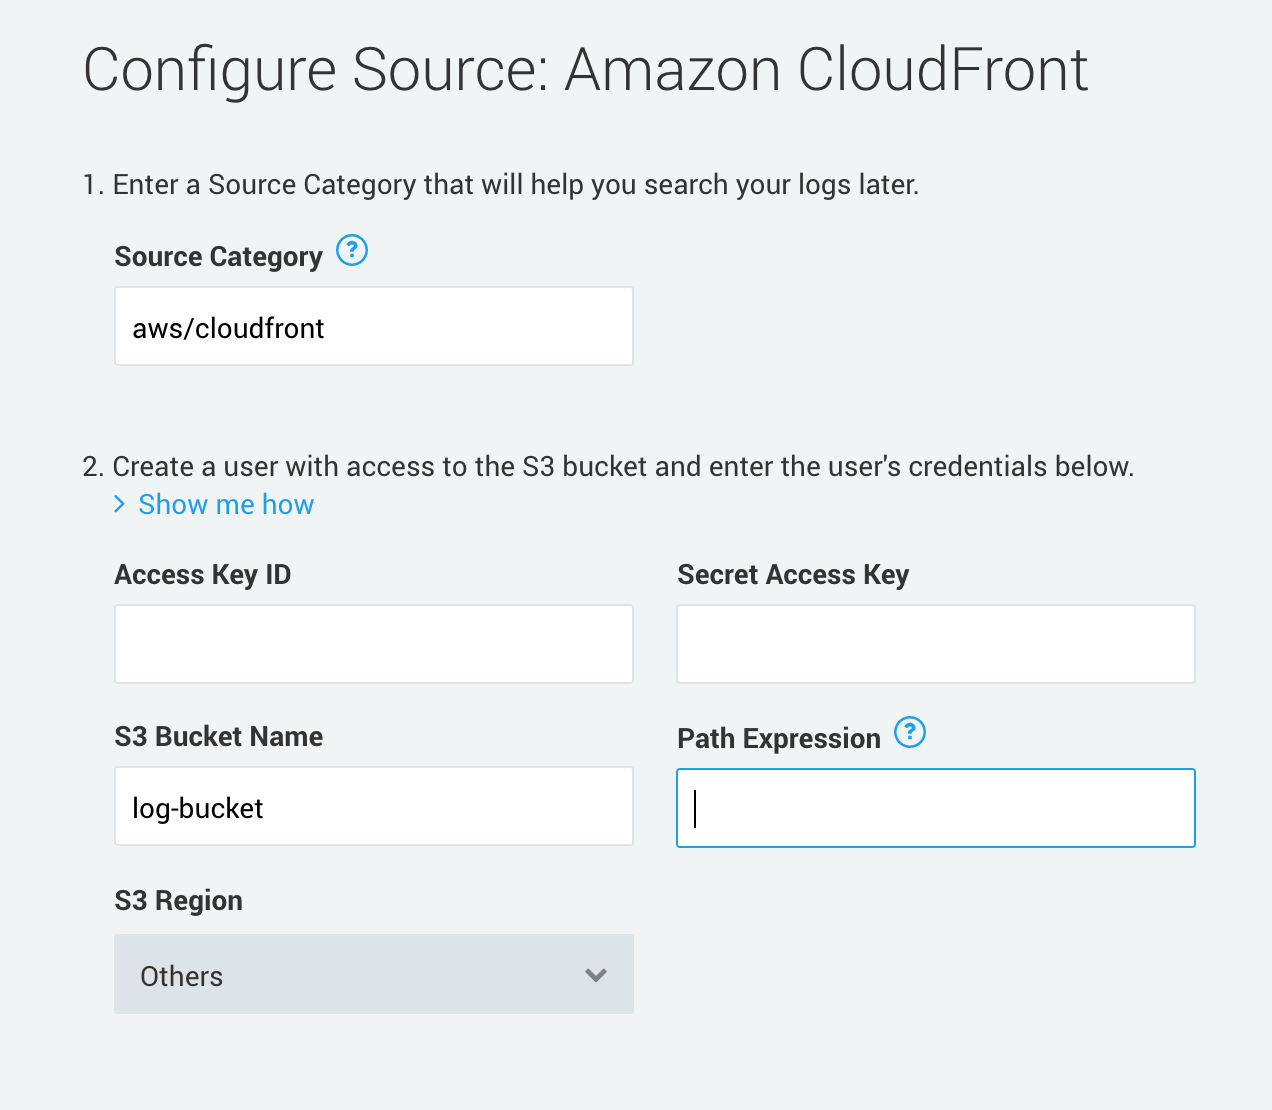
Step 4: Configure the source of your CloudFront logs:
Step 5: Use the generated IAM policy if you haven’t already set one up:
Step 6: Finish and use your dashboards!
Dashboard screenshots
There are three dashboards that come out of the box when setting up Sumo Logic:
- Amazon CloudFront - Overview
- Amazon CloudFront - Visitor Statistics
- Amazon CloudFront - Web Operations
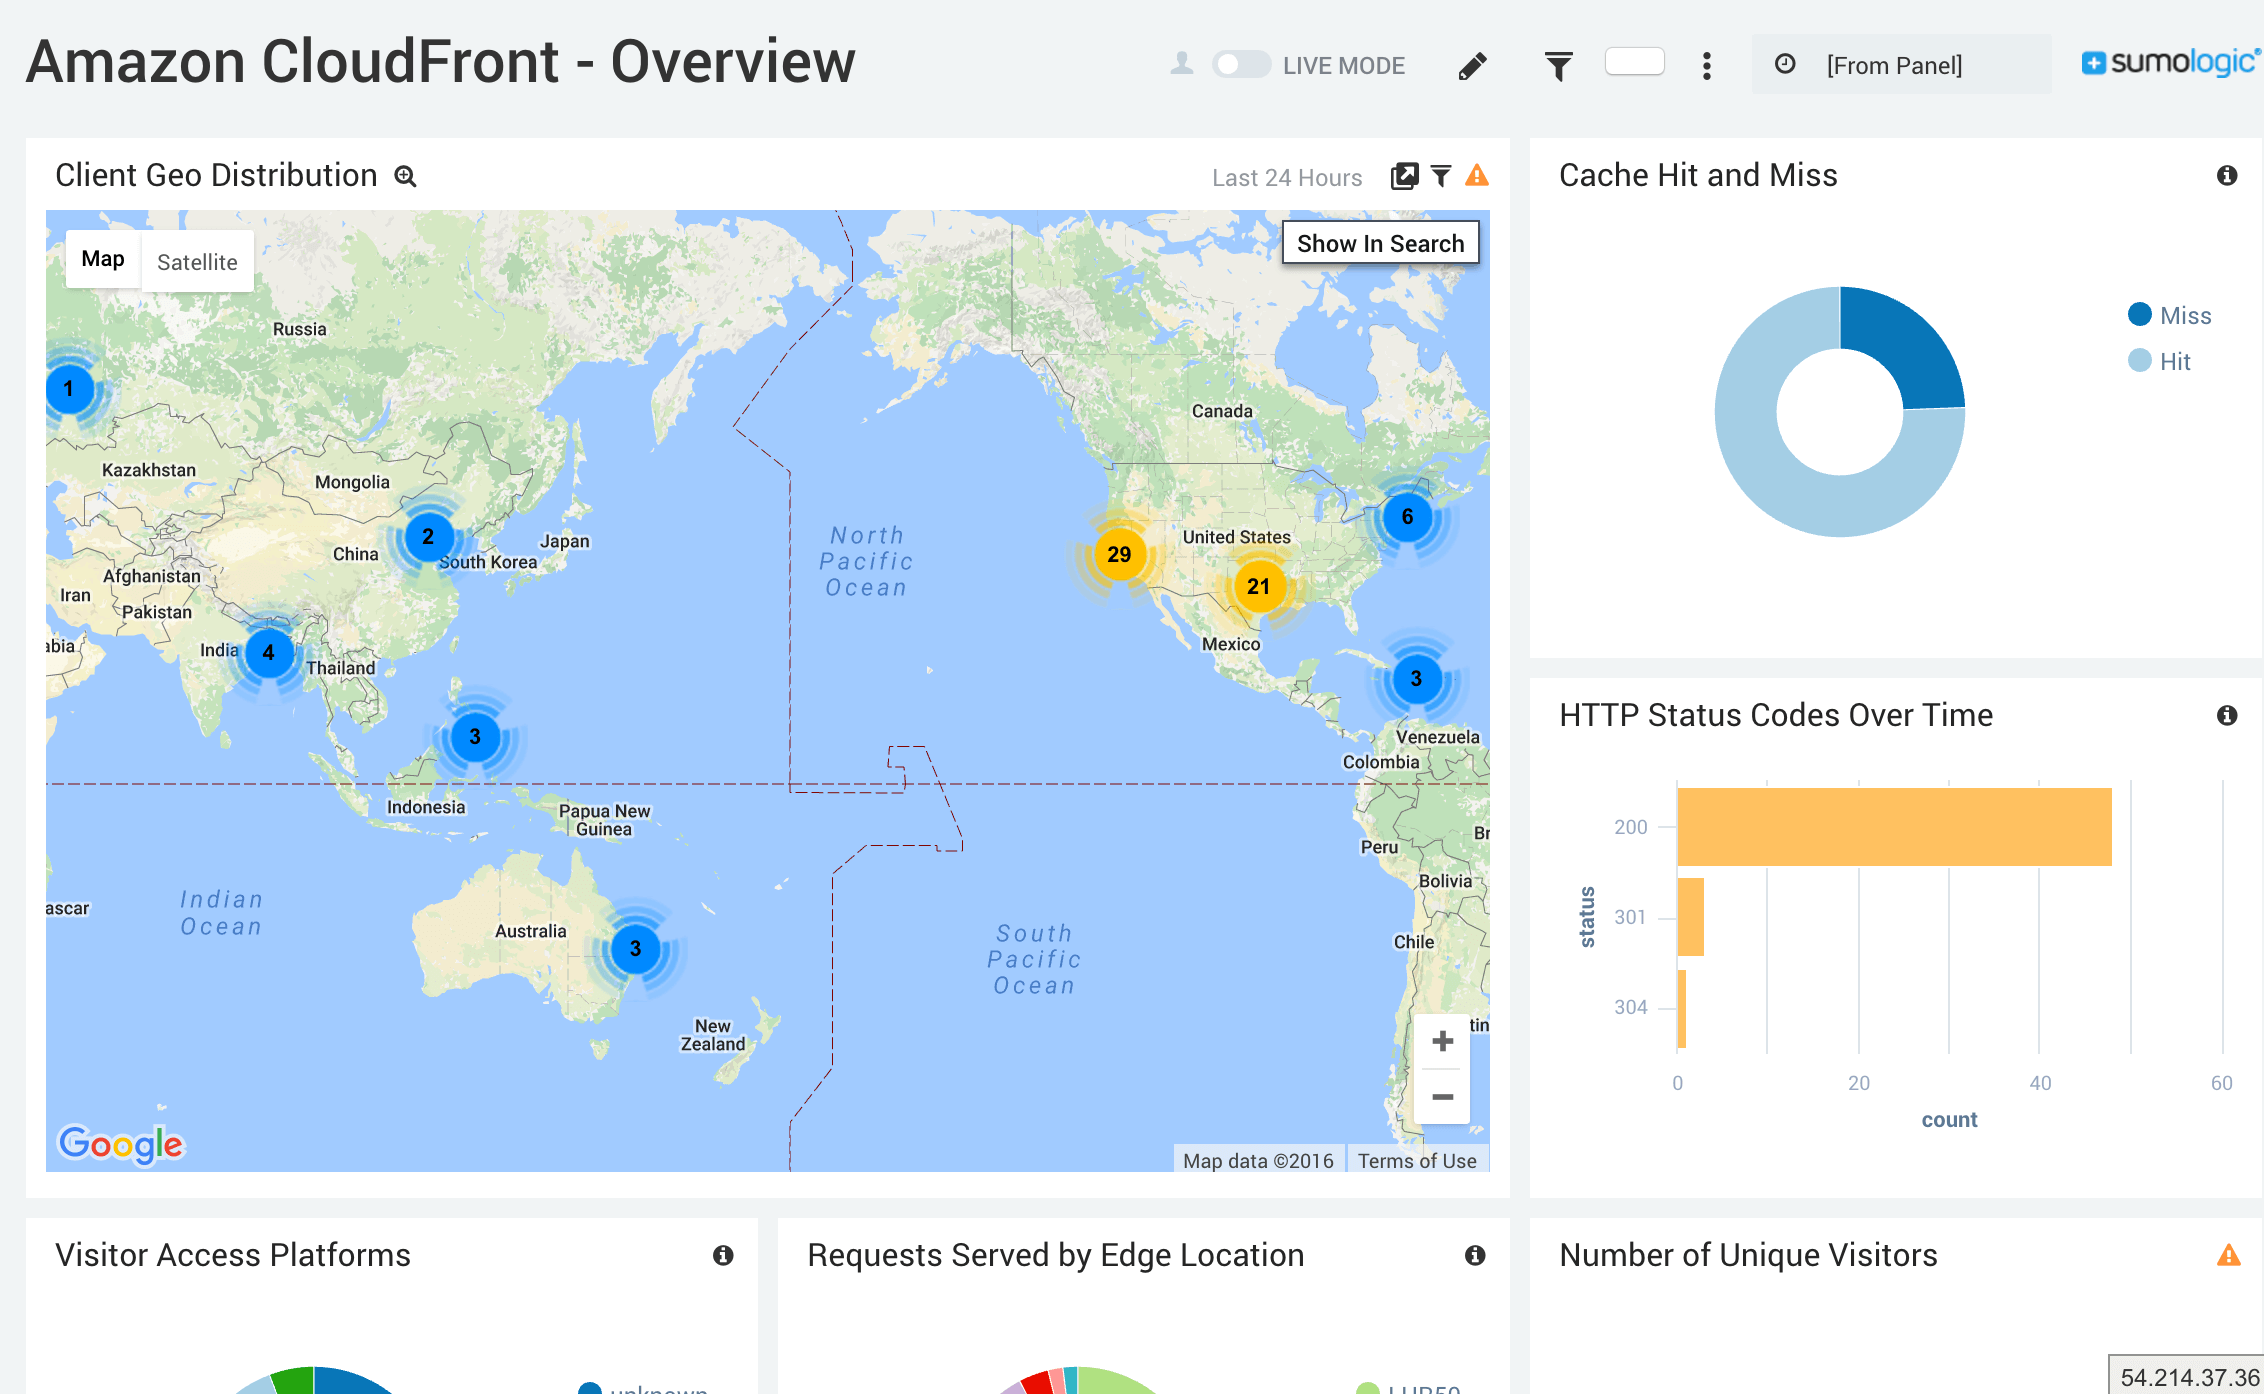
CloudFront Overview
High level overview of your traffic including a mapping of where your users are coming from, edge locations where your requests have been served, cache hit/miss, HTTP status codes, unique visitors:
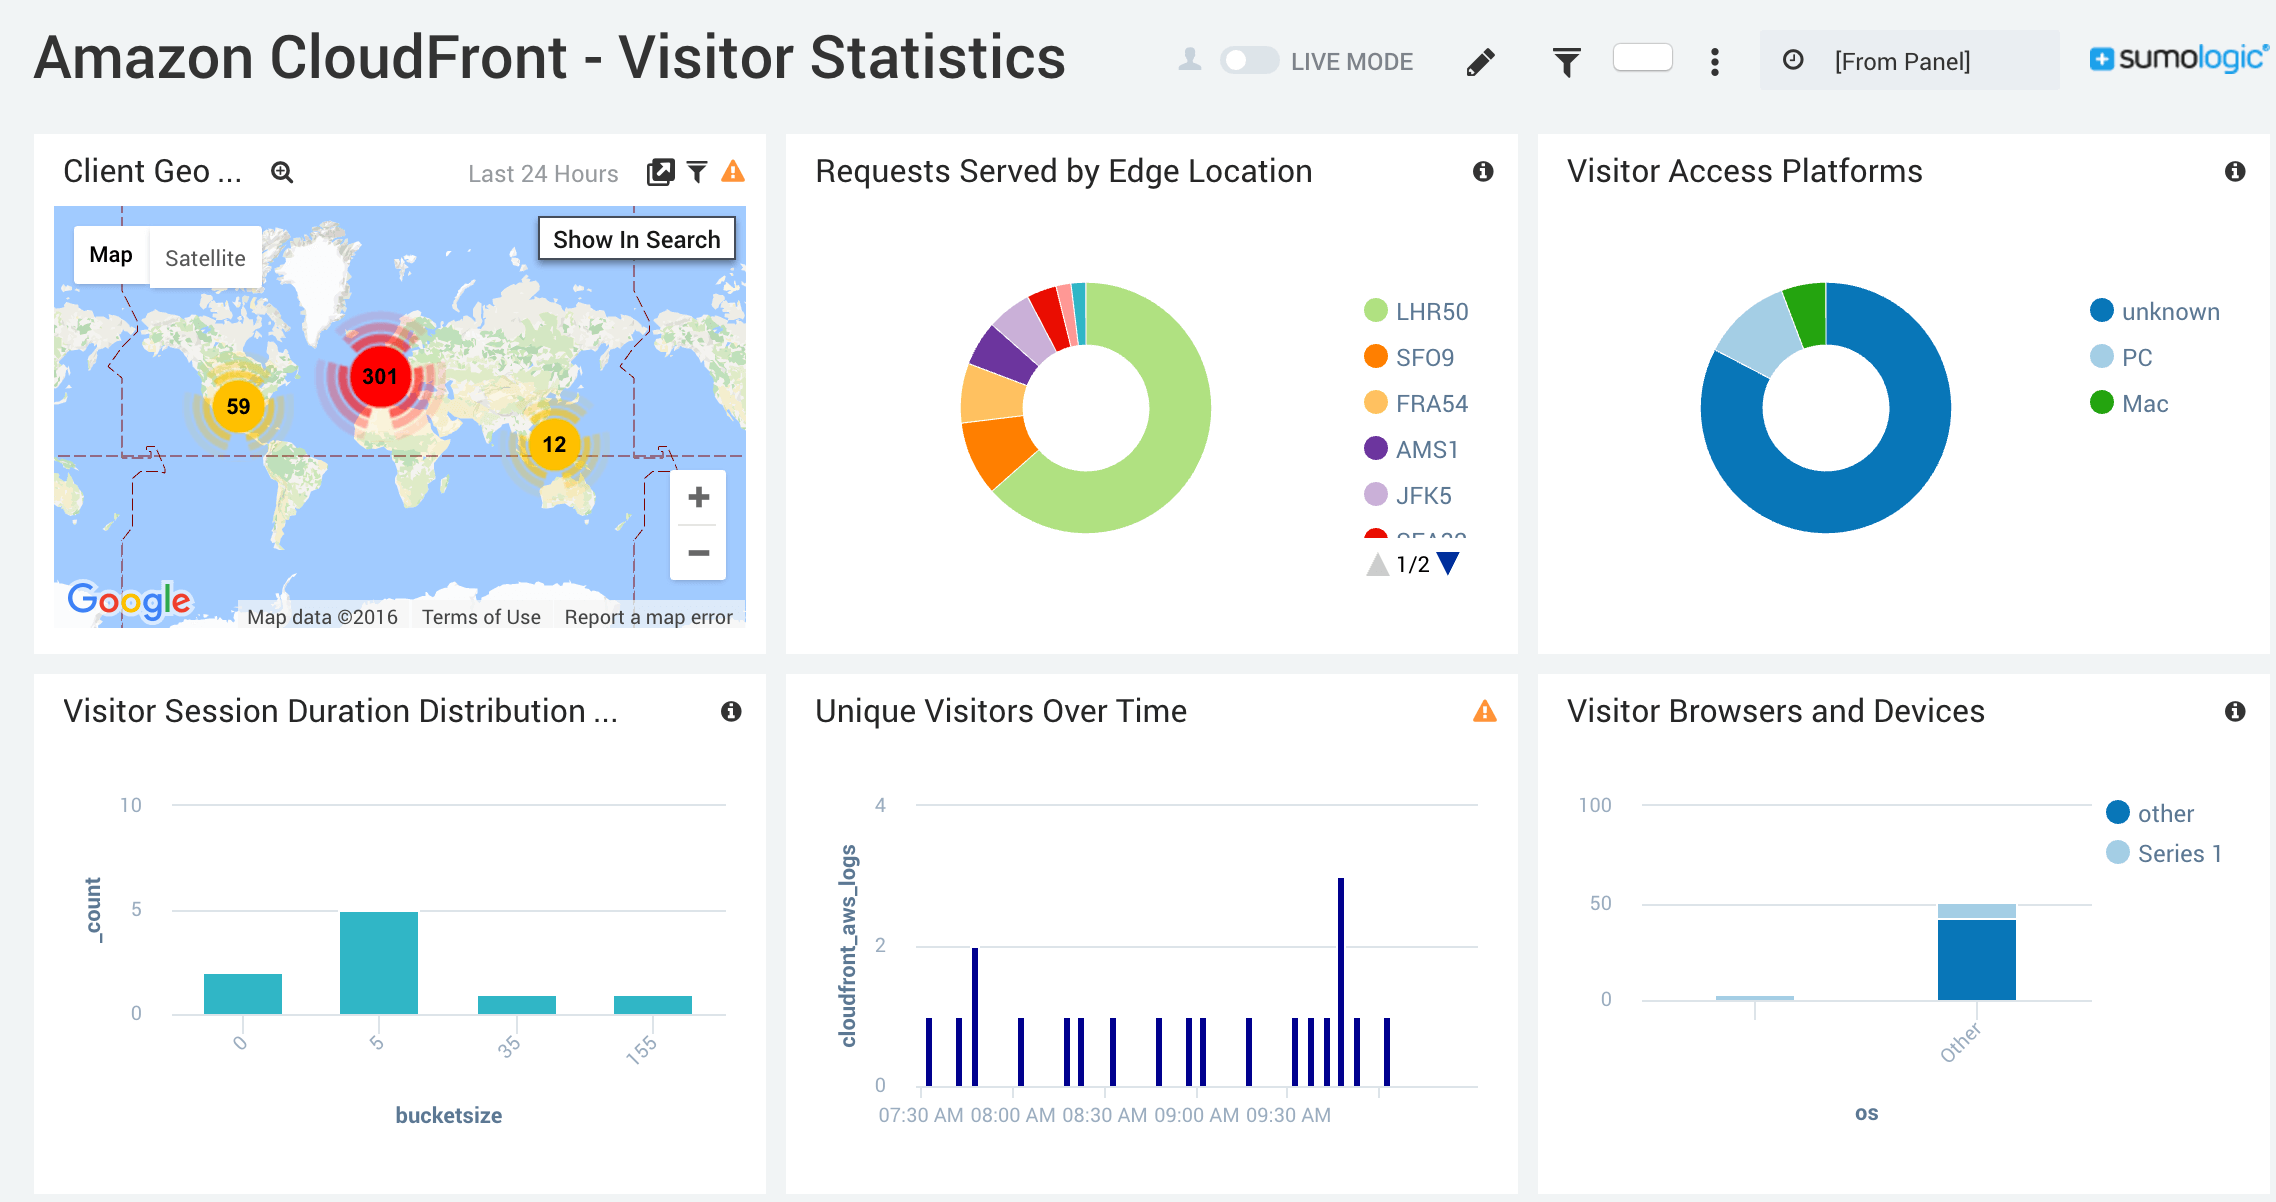
CloudFront Visitor Statistics
This is a drilling down a level further. You get the same overview information showing client geography and which edges your content has been served from as well as additional client information.
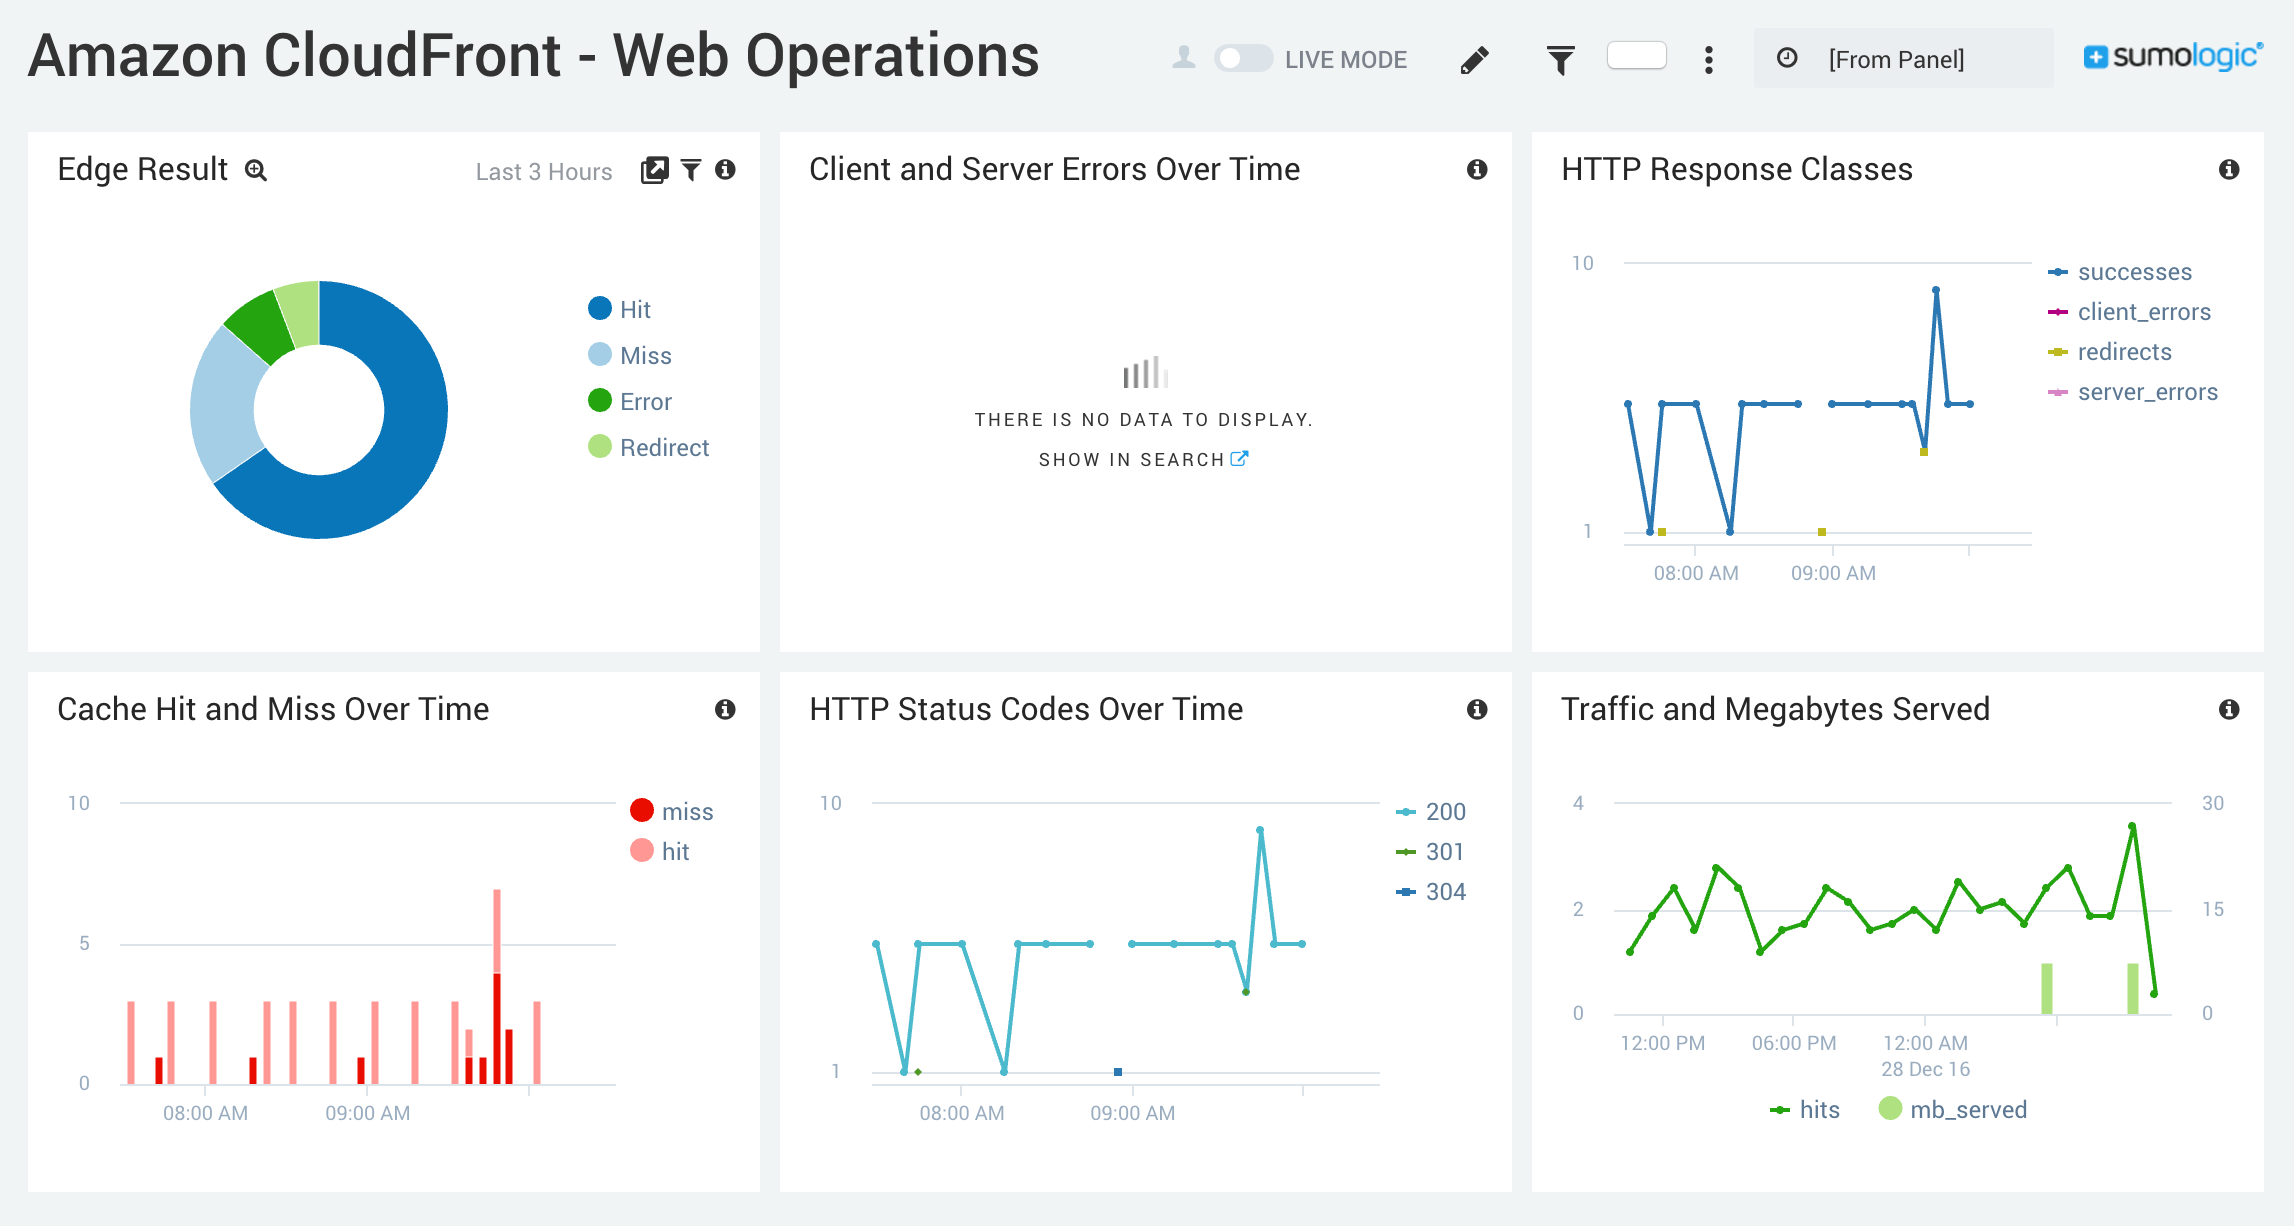
CloudFront Web Operations
This dashboard digs more into more operations-centric metrics including things like cache hit/miss (which can have performance impacts), HTTP status codes (make sure you’re not serving lots of 400’s or 500’s), traffic served (how much you’re spending in bandwidth)
Conclusion
Sumo Logic is a great service for processing your Cloud Front logs, and even the free tier gives you some visibility into what’s going on, though you can’t look back further than 7 days. I do pay for services from a lot of SaaS providers for personal projects, but the $108/mo to get 30 days of retention and 1GB of daily data volume (I use way under the 500MB/day provided by the free tier) is steep for a simple tech blog like this.